Quantifying the energy efficiency of fine grinding circuits
![]()
![]()
![]()
![]()
![]()
In previous publications, we have described how the size specific energy (SSE) can be calculated to predict the energy required to generate new minus 75 µm material.
However, if we want to benchmark the performance of fine grinding where the product can be much finer than 75 µm, clearly we require a finer marker size. If we do this, we also need a way to compare results that use different marker sizes.
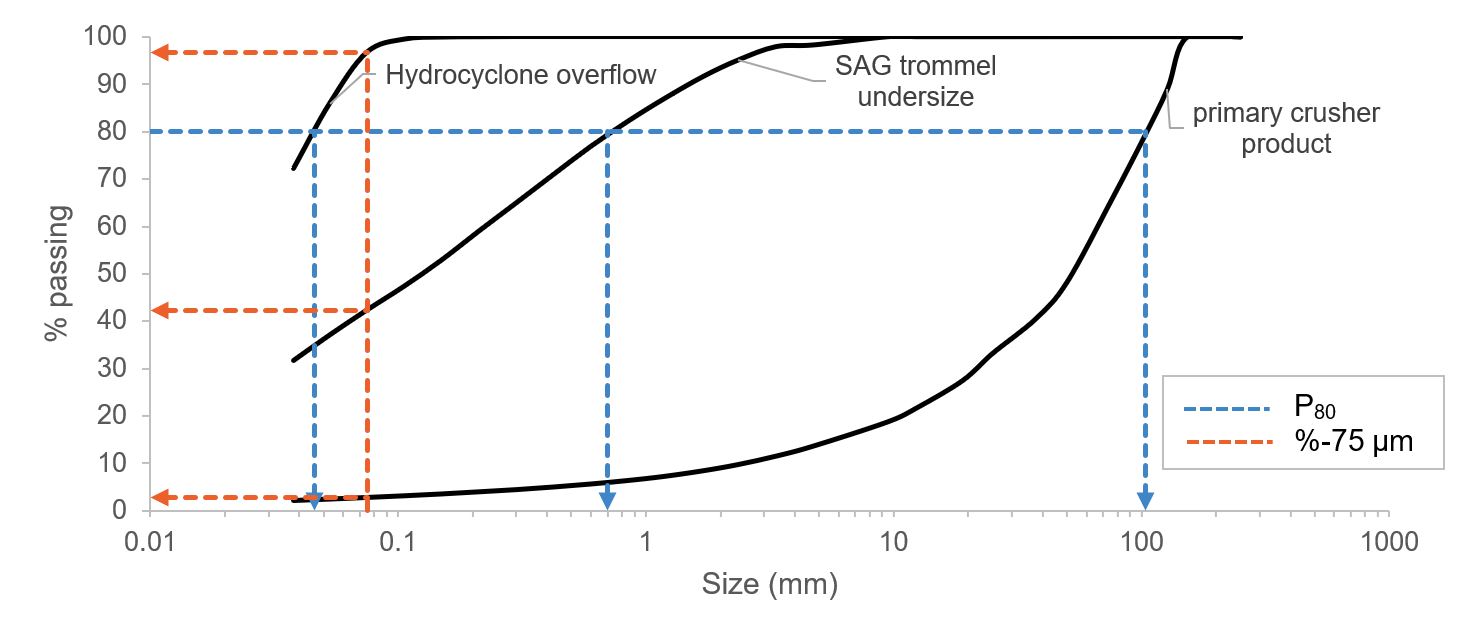
Benchmarking energy efficiency requires three measurements: comminution power, rock throughput and the resulting size reduction. The first two measurements are fairly objective, however, the third is subjective and could be measured in numerous different ways. Two of the most popular methods for estimating grinding energy requirements are the Bond operating work index (OWi) and the Morrell specific comminution energy method. Both relate the comminution energy to the reduction in the 80th percent passing size of the feed and product streams (F80 and P80). An important condition that needs to be met for using the Bond formula is that the distributions should have a similar slope, and correction factors (such as those introduced by Rowland in 1982) attempt to accommodate cases when slopes are different. Size Specific Energy (SSE) differs by relating the grinding energy to the quantity of new fines generated. For typical circuits that involve AG/SAG, HPGR or ball milling, the generation of -75 µm material (denoted as SSE75) is a suitable marker size with which to benchmark performance because it contains 80% of the surface area generation1 and energy is proportional to surface area generation2. As shown in Figure 1, whereas the Bond method uses particle size data from the x-axis, the SSE method uses the % passing data from the y-axis. The three size distributions depicted in this figure were obtained from a conventional SABC circuit and represent the primary crusher product, the SAG trommel undersize and the hydrocyclone overflow. In this example, the OWi of the SAG mill was found to be 30% higher than the ball mill, thus suggesting that the SAG mill was less efficient than the ball mill. The apparent inefficiency of SAG mills when using Bond analysis is widely understood to be due to the difference in the slopes of the size distributions. In contrast, when the SSE75 was calculated, it showed the SAG mill consumed 20% less energy to produce final product material than the ball mill. Since the aim of a comminution circuit is to generate final product material, the SSE methodology gives a fairer indication of energy efficiency.
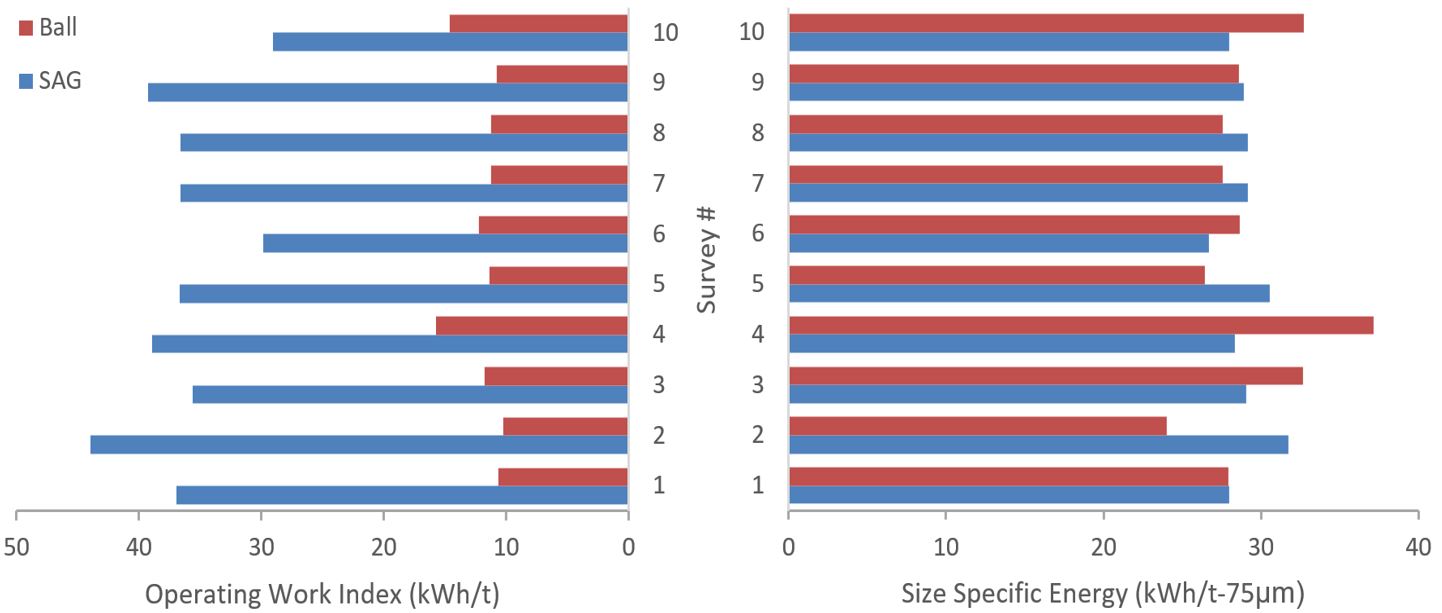
To further explore the difference between the OWi and SSE, data from ten surveys of the same comminution circuit were compared using the two approaches (see Figure 2). The OWi results differ significantly (factor of 3 times) whereas the SSE method results are more consistent and show that both mill types produce fine particles roughly in proportion to the energy input. In fact, in four of the surveys, the SAG mill was found to be more efficient at producing circuit product than the ball mill. Similar results have been seen consistently across all the surveys where this approach has been used, including circuits with AG mills, pebble mills, HPGR, stirred mills and ball mills with fine screens.
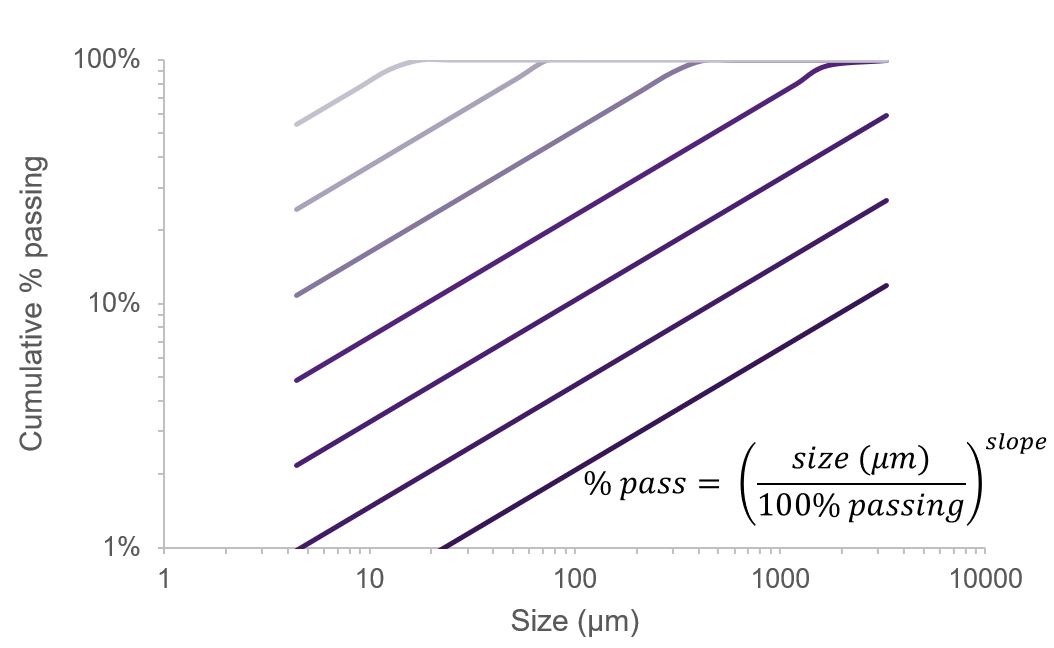
Bond’s method of quantifying size reduction by measuring the F80 and P80 relies on parallel particle size distributions in log-log space (see Figure 3). The Gates-Gaudin-Schumann (GGS) ideal power law size distribution equation was used to test the difference between the three approaches (Bond, Morrell and SSE). Through this process we found that the results from the SSE approach could provide the same result as both the Bond and Morrell approaches depending on the gradient of the size distributions. When the gradient of the size distributions equalled 0.5, the SSE was mathematically equivalent to 1.44 times the OWi. This result is consistent with Bond’s approach as he found that the GGS slope was “often about 0.5”3. And SSE was proportional to the Morrell approach when the gradient of the size distribution equalled the Morrell exponent parameter (0.295 + P80/1000000)4. This result potentially shows that the Bond and Morrell approaches could actually be special cases, and SSE could have more general application. 
As referred to earlier, the size-specific energy calculation has typically been conducted at a marker size of 75 µm5,6,7 because of the size reduction range of the equipment being assessed. However, in order to apply the technique to fine grinding devices such as stirred mills requires the use of a finer marker size. For instance a marker size of 25 and 38 µm has been used to assess the performance of TowerMills and Vertimills8. However, no methodology is available to link the results from different marker sizes.
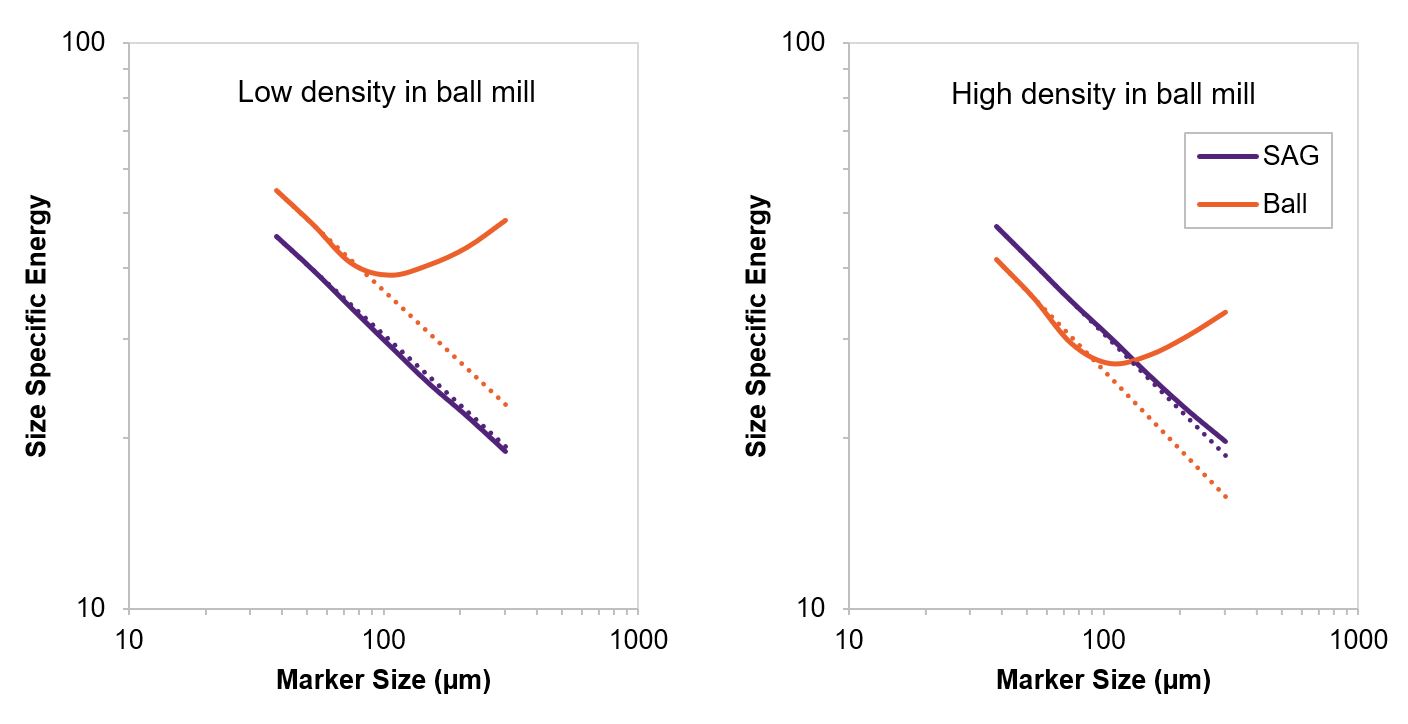
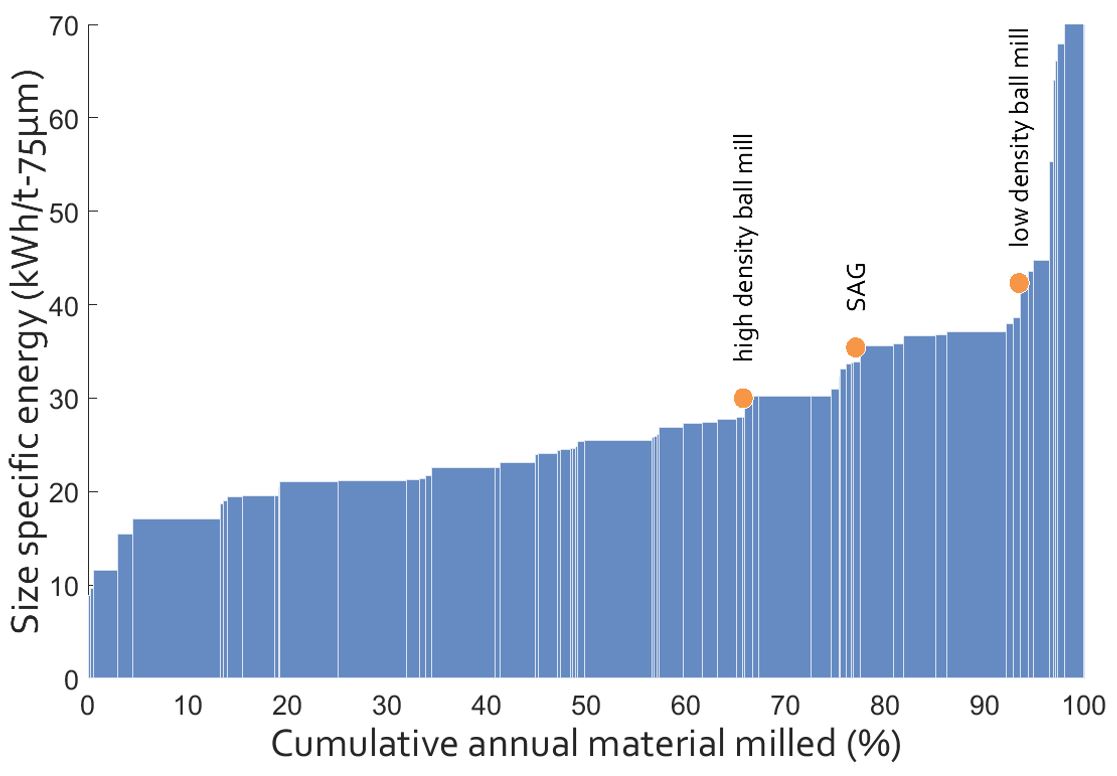
The ideal GGS size distribution investigation presented above was used to find a relationship between marker size and SSE. The SSE increased linearly (in log-log space) as the marker size decreased, and this ideal case where the size distribution followed a power law function, was found to be consistent with the measured data from many site surveys. This relationship between marker size and SSE can be used to link results from different marker sizes to apply SSE over a wider range of size distributions. Therefore, when fine grinding precludes the use of 75 µm as the marker size, an effective SSE75 can be extrapolated from the SSE at a finer marker size and the gradient of the relationship. Figure 3 shows two survey results from the same SAG and ball mills. In the first survey the ball mill was underperforming due to the low density in the mill, which was rectified in the second survey. The ball mill was grinding to a P80 of 50 to 70 µm, therefore the traditional marker size (75 µm) was not applicable, and this can be seen by the increase in SSE for coarser sizes as the marker size approached P100. Using a finer marker size and the gradient of the relationship between log(SSE) and log(marker size), an equivalent SSE75 could be extrapolated. This approach allowed the data to be mapped on to the standard SSE intensity energy curve (see Figure 4), which is based on a 75 µm marker size. These results show that the ball mill operated poorly at low densities, performing in the bottom 5% of mills in the database (95th percentile). By increasing the density of mill, it moved towards a more average operational regime, resulting in performance at the 65th percentile in the database.
The presented method provides a consistent measurement of comminution energy efficiency across the circuit, independent of the particle size gradient and fineness of grind.
- Musa, F., Morrison, R., 2009. A more sustainable approach to assessing comminution efficiency. Minerals Engineering 22, 593-601.
- Rittinger, P.R., 1867. Lehrbuch der Aufbereitungskunde. Ernst and Korn, Berlin.
- Bond, F.C., 1961. Crushing and Grinding Calculations Parts 1 and 2. British Chemical Engineering 6, 378-385, 543-548.
- Morrell, S., 2009. Predicting the overall specific energy requirement of crushing, high pressure grinding roll and tumbling mill circuits. Minerals Engineering 22, 544-549.
- Davis, E.W., 1919. Fine crushing in ball-mills. Transactions of the American Institute of Mining Engineers 61, 250-296.
- Hukki, R.T., Allenius, H., 1968. A quantitative investigation of the closed grinding circuit. Society of Mining Engineers, AIME, Transactions 241, 482-488.
- Schönert, K., 1988. A first survey of grinding with high-compression roller mills. International Journal of Mineral Processing 22, 401-412.
- Palaniandy, S., Halomoan, R., Ishikawa, H., 2018. Shifting the comminution workload from the primary ball mill to TowerMill Circuit, AusIMM Mill Operators' Conference, Brisbane, Australia.