The decision process around the adoption of energy efficient comminution technologies is a complex one with multiple factors at play. Depending on the company and the individual personal drivers, the weight of different motivating influences may vary between energy cost, environmental concerns, improved productivity, inadequate energy supply, carbon emissions/pricing, community perception, risk avoidance, and others. All of these factors can be valid reasons for adopting energy-efficient technologies. However, it is a hard task to answer all of these challenges individually; especially since many are not mutually exclusive. The energy curve project has so far concentrated simply on productivity measures such as kWh/t, but the question has always remained: “how will the curves change if energy cost and carbon emissions are adequately addressed?”
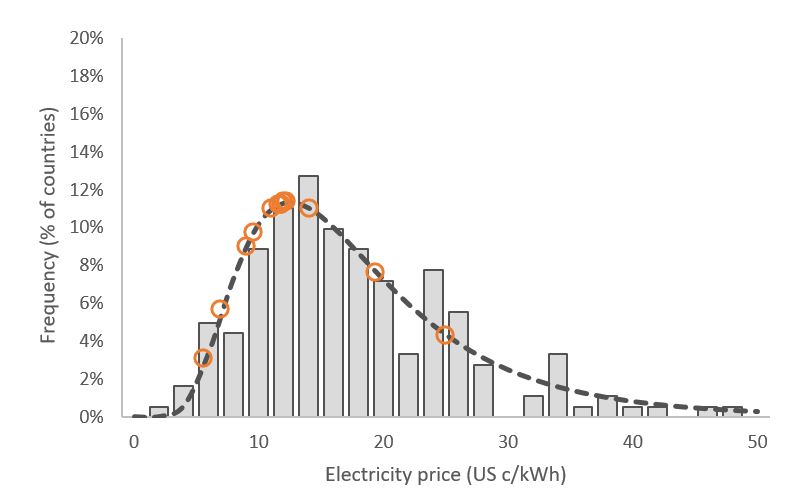
The price a mine pays for electricity is dependent on the geopolitical jurisdiction (countries/states), local infrastructure and contracts with energy suppliers. An example of this variation is displayed in the graph that contains electrical price data from 61 countries. The average price for electricity in these countries varies between 2 and 320 USD/MWh with 50% of countries paying less than 135 USD/MWh. The top 10 gold and copper mining countries are highlighted as circles on the graph and it can be seen that all but one are paying below average prices for electricity. These low power costs will be reflected in the decisions of mining companies, but they also represent a possible future risk as electricity prices are likely to rise globally. A good example of price increase is Zambia[1] where mining consumes more than half the electricity, and this year power costs have risen to reduce the amount of government subsidy as previously they were not cost-reflective.
This price variation directly impacts the economic value that can be achieved by companies employing energy efficient comminution technologies. There are two examples that clearly highlight the effect of electricity price on decision making. Duffy, Valery, Jankovic and Holtham (2015) [2]investigated the net present value that could be obtained by replacing cyclones with high frequency screens in a publication at the Third International Future Mining Conference. They found that if energy savings of 15 per cent or greater were obtained in the ball milling circuit (a reasonable assumption), fine screens would only be justified where the electricity price was greater than 150 USD/MWh. Ballantyne, Powell, Clarke, Di Trento, Kock and Putland[3] presented a case study into HPGR circuits at the 2016 SME conference. They found that AngloGold Ashanti’s Tropicana and Gramalote projects showed similar reductions in energy consumption for HPGR-based circuits in comparison to SAG-based circuits. However, the value of this energy reduction for Tropicana was not as great for the Gramalote project because electricity was 3 times cheaper at the Tropicana site. Thus, the decision was made to employ a HPGR-based circuit at Tropicana and a SAG-based circuit at Gramalote.
[1] http://www.bloomberg.com/news/articles/2016-02-11/zambia-says-mines-will-have-to-live-with-higher-power-tariffs
[2] Duffy, K., Valery, W., Jankovic, A., Holtam, P., 2015. Resource efficient mining processes of tomorrow, Third International Future Mining Conference, Sydney, Australia.
[3] Ballantyne, G.R., Powell, M.S., Clarke, N., Di Trento, M., Kock, F., Putland, B., 2016. Energy curve case study (AngloGold Ashanti), SME Annual Conference and Expo (ACE), Phoenix, Arizona.


