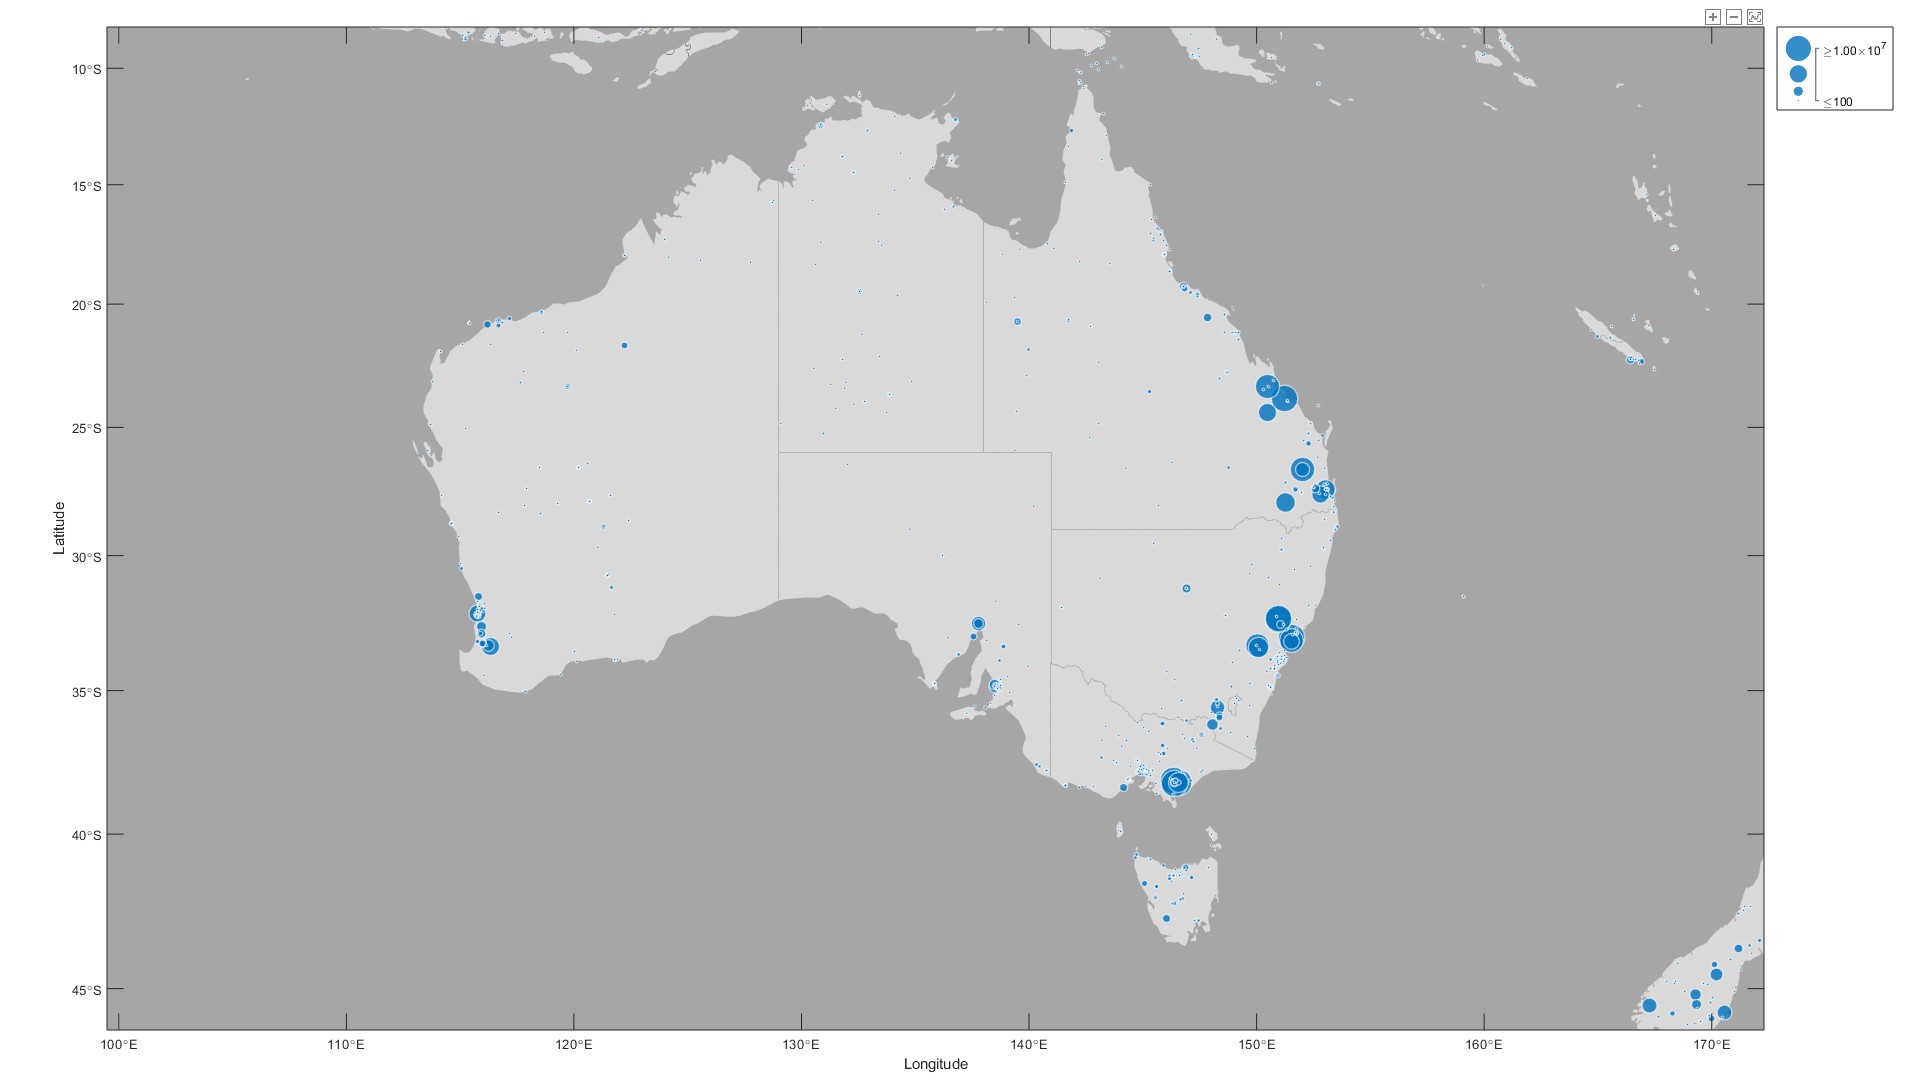
In addition to the country the mine is operating in, the electricity price can depend on the geographical location, local infrastructure, fuel and generator type, the relevant energy contracts and many other factors. There are even cases where regional synergies allow neighbouring businesses to trade electricity at favourable prices[1]. The average price paid for electricity can vary more than ten-fold depending on the country[2], and the local variations can similarly be large. There is also typically a fixed cost component used in combination with the variable cost that is dependent on energy consumption. Because of the multiple factors at play, the intra-country variability can be difficult to predict accurately.
The electricity prices paid by 15% of the mines in the energy curve database are known. Comparing these recorded prices to the reported electricity price in the country of the mine’s location, gives an indication of the local (intra-country) variability in electricity prices paid by mining companies. Figure 2 shows the ratio of reported electricity price as a proportion of the average industrial electricity price of the country where the mine is located as reported by the World Bank (2017). This ratio has been presented for all the available mines as a cumulative frequency distribution. The dotted line in Figure 2represents a cumulative normal distribution that has been fitted, truncated at 20% and fitted to the measured data. From these data it can be seen that more than 60% of the mines in the database pay less than the average electricity cost of the country where they are located.
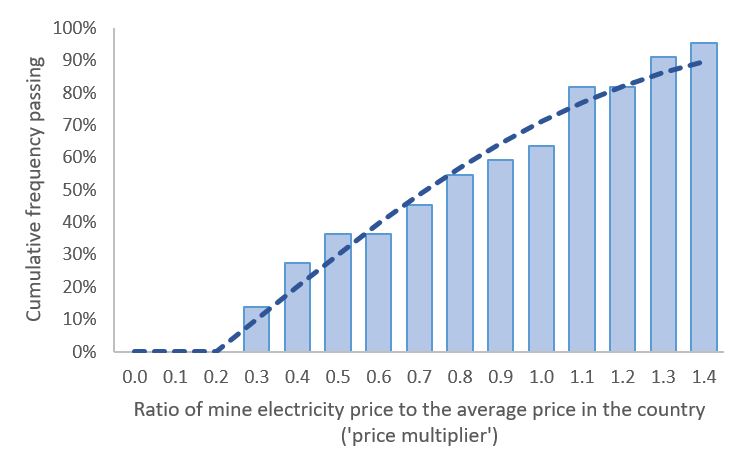
A realistic representation of the distribution of comminution energy prices in mining using this technique. The average price of electricity is available for 61 countries globally. This country cost can be combined with a local variability factor that reflects the distribution in the figure. The factor can be either randomly prescribed, or made to vary systematically with some variable. The most obvious variable that can be used is the proximity of a mine to electricity generating assets due to transmission costs.
[1] Bossilkov, A., Berkel, R.v., Corder, G., 2005. Regional Synergies for Sustainable Resource Processing: a Status Report Project 3A1: Enabling Tools and Technologies For Capturing Regional Synergies Centre for Sustainable Resource Processing, http://www.csrm.uq.edu.au/docs/3A1StatusReport_final_June2005.pdf.
[2] World Bank, 2017. Doing Business - Getting Electricity, www.doingbusiness.org.


