In previous blog posts we have shown the variability in the average electricity price in different countries (2 to 320 $US/MWh), and across different mines in the same country (20 to 140% of the country average).
In an attempt to develop a model to obtain a realistic representation of the distribution of comminution energy prices in mining, the proximity of the mines to a local electricity generator, and the closest population centre was measured. The mine locations were found using Mining-Atlas and the location of power stations (greater than 25MW) were found using the Global Energy Observatory. Cities with greater than 100,000 people were considered ‘major’ and used as references to measure the distances to population centres. Census data from the corresponding national government was used to estimate the population of each city. The measurement function built into Google maps was used to estimate distances between sites, power stations and cities.
The figure below displays the frequency distribution of the distances of all the mines in the Energy Curve database and their distance to both power stations and major cities. The data approximately follows a decay function with a large proportion of mines occurring less than 300 km from major cities or power stations. However, there is a large population of mines that occur close to 600 km from both power stations and major cities. This is due to the bias in the database to gold and copper mines in Australia and thus the mines in the Kalgoorlie belt that lies approximately 600 km from Perth, the closest major city and power station. With this special case removed, the proximity of the mines followed a log-normal distribution, the same that was used to map the electricity price variability.
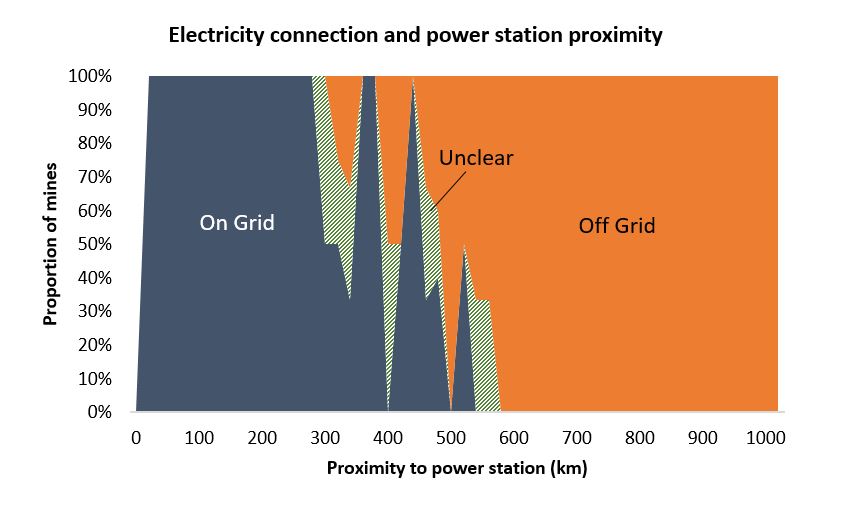
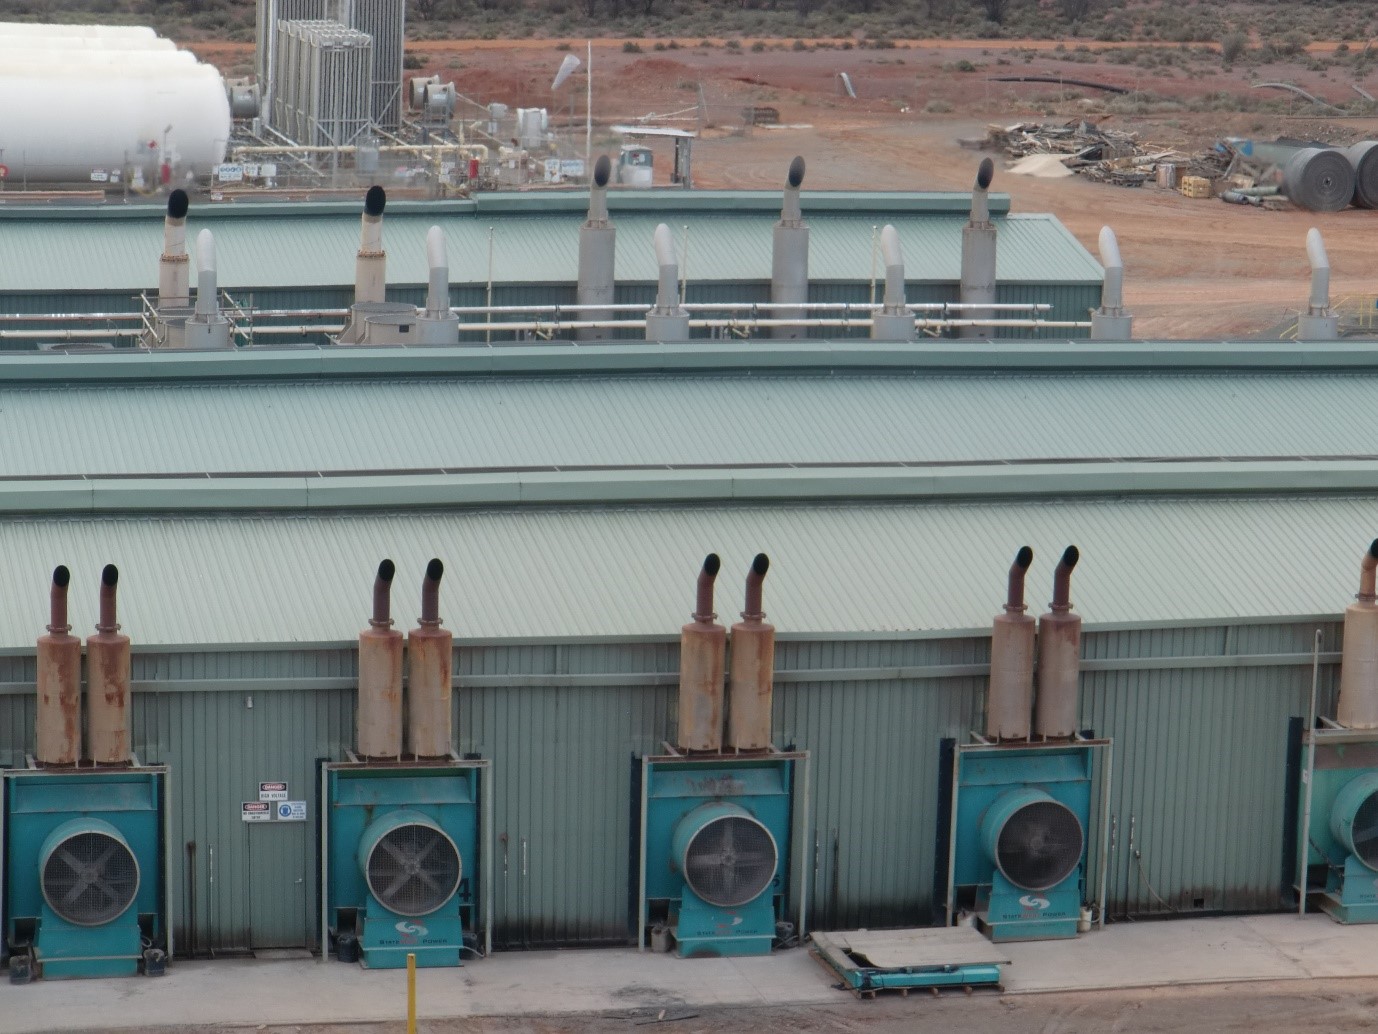
In addition to the distance of mine to a power station, a key factor in determining the cost and environmental impact of electricity for a mine site is the source of electricity. Mines can be categorised as either on grid where it is connected to an electricity network or off grid with power generated onsite. Since the majority of sites do not disclose whether they are or are not connected, visual analysis of satellite imagery was used to identify if a site was connected to the grid. Electrical substation and a high voltage power connection were used as visual confirmation of a site’s connection to the grid. If these were not present, signs of on-site natural gas and diesel power stations were investigated. Sites without clear grid connection or visible on site power generation facilities were documented as unclear. A relationship was identified between the distance of a site from power stations and whether they were connected to an electrical grid. It is clear that sites that are within 300km of a power station are connected to the electrical grid while those that are over 600km away depend upon onsite power generation.