Assessment of comminution energy intensity has traditionally been confined to the crusher and mill motor power consumption. However, a measure of ancillary equipment power consumption is required to fairly compare disparate equipment types and circuit configurations. For instance, dry comminution circuits, such as those incorporating high pressure grinding rolls (HPGR), may have a power advantage in rock breakage but use more power in material transport as they typically require an extensive conveyor system. Whereas wet milling circuits use less ancillary power as they usually require fewer conveyors. Both circuits require similar sized slurry pumps as this is more related to the require circulating load around the ball mill. Therefore, if the power consumption of the ancillary equipment such as conveyors is not taken into account, wet grinding circuits may be at a significant disadvantage in direct power consumption comparisons. Therefore, wet grinding circuits may be at a significant disadvantage in direct comparisons if the power consumption of the ancillary equipment is not taken into account. The Comminution Energy Curve database records the power consumption of ancillary equipment, however this has not previously been included in the published curves. This deficit is addressed below.
The power consumption of conveyors is influenced by a number of factors including: length, lift, capacity, velocity, belt width, belt type, weight of belt and rotating parts, frictional resistance of belts and pulleys, friction coefficient between the material and the skirtplates, and other factors. Equations are available (such as international standard: ISO5048) to size conveyor motors based on these parameters, however for this exercise a simplified relationship was required. In order to create a simplified model for conveyor power based on throughput and transport length, realistic values were chosen for all other factors. The result was a value for conveying power of 0.25 kWh/t.km. Taking into account that conveyors are typically sized on 1.6 times the instantaneous throughput, this figure increases to 0.40 kWh/t.km. This figure allowed realistic estimates to be made for conveying power where actual data was not available.
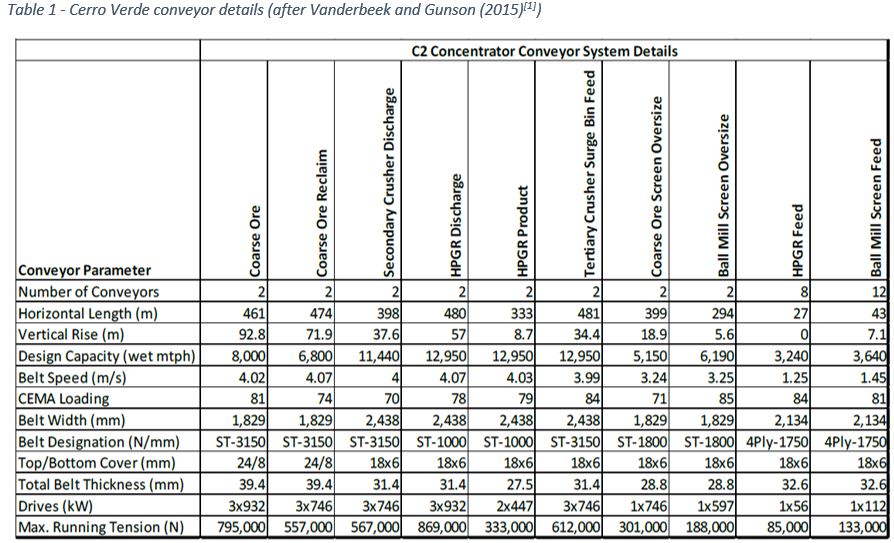
The majority of the Comminution Energy Curve database is composed of semi-autogenous grinding (SAG) and ball mill circuits. In these circuits the conveying power is limited to the transport of material from the primary crusher to the SAG mill and pebble recycle stream. Based on experience and the energy curve database, a typical primary crusher and the SAG mill can be assumed to be 1 km apart, consuming about 0.40 kWh/t in conveying power. Another 500 m of conveying can be assumed to be required for the pebble recycle, but since the flowrate is only about 10% of the feed, the contribution of the pebble recycle may be as low as 0.02 kWh/t. For HPGR and crusher heavy circuits the conveyor distance can be assumed to be much greater, and are approximately between 5 and 9 km. For instance, the HPGR circuit at Cerro Verde has 16 major conveyors with a combined length of 7.4 km and a total installed power of 31 MW (see Table 1). Taking into account the instantaneous throughput of 10,000 t/h, this equates to 3.1 kWh/t, or 0.42 kWh/t.km, similar to the calculated figure presented in the previous paragraph.
A similarly simple relationship was required to approximate the energy used in pumping slurries from the outlet of a SAG mill to an elevated cyclone nest. The required pump power needed to lift a slurry under a given set of conditions is a matter of relatively simple fluid mechanics, albeit one which must be approached with a constant awareness of the implications of pumping a slurry, as opposed to a single phase Newtonian fluid. The major factors affecting pump power are the height of the cyclone nest above the pump, cyclone pressure, internal pipe diameter, pipe length, pipe roughness, slurry velocity, slurry density, slurry viscosity, and other factors. Average values for most of these factors are available, except the internal pipe diameter which is expected to vary widely based on the throughput at a given plant. However, we can take advantage of the fact that the design velocity for a slurry pumping application is going to be constrained by the need to avoid both solids settlement and excessive pipe erosion - which respectively impose lower and upper limits on the allowable velocity. While there is no theoretical basis for estimating the appropriate velocity - or the bounds of a suitable range of velocities - empirical relations do exist, such as Durand’s relationship in the Weir slurry pumping manual. The average pumping power recorded in the energy curve database was 1.6 kWh/t which agreed closely with these calculations.
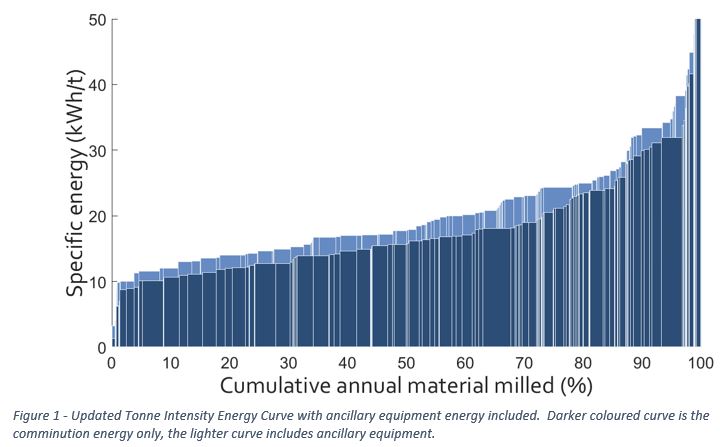
The conveyor and pumping power were added to the specific comminution power to create a new Tonne Intensity Energy Curve that included the power intensity of these ancillary equipment. Figure 1 displays the standard comminution specific energy as a dark coloured energy curve in front of the tonne intensity curve including ancillary energy. The difference between the two curves is not large, but it is important to reflect the increased ancillary power consumption of HPGR and crusher-heavy circuits.