
The minerals industry invests a great deal of energy in comminution, both in terms of capital costs and operating costs. A number of people have published estimates of how much of the energy is consumed in comminution, including Ballantyne and his co-workers (2012) who estimated that in 2008-2009 1.3% of Australia’s energy was consumed in comminution circuits in gold and copper operations. Ballantyne et al. (2012) estimated how much of the energy consumed in the minerals industry is used in comminution and the data show in Figure 1 below show the range of some of these estimates. Although there is some variation in the estimates it is clear that the amount of energy consumed in comminution is significant and the development of the Energy Curves approach arises from the minerals industry’s wish to quantify and reduce this energy consumption.
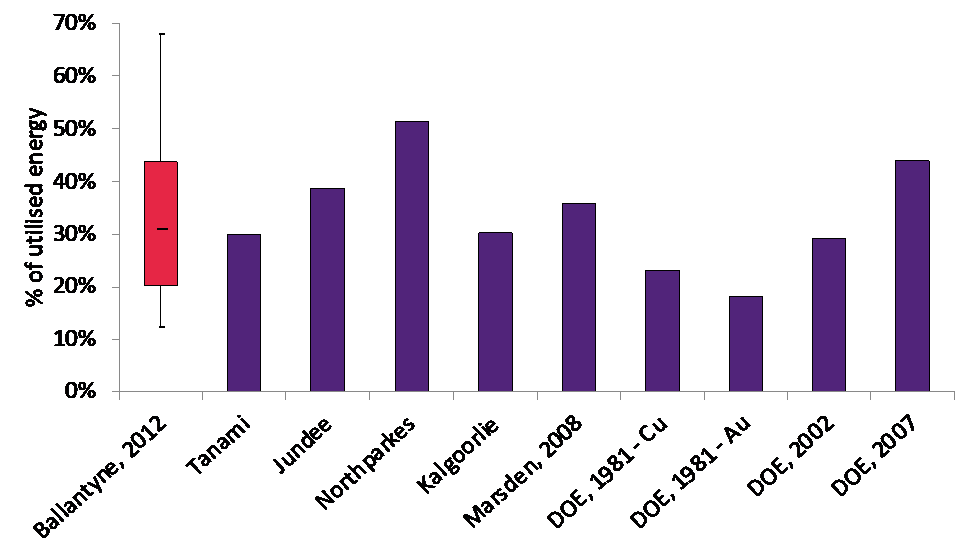
Figure 1 – Published data on proportion of mine energy used in comminution (Ballantyne et al. 2012)
In most mining operations the purpose of comminution is to prepare the ore as the feed to a separation process by liberating minerals prior to the separation stage(s). Exceptions to this include aggregate production and the iron ore industry where crushing to a product size specification may be the only processing step required. However, for base and precious metal operations the ore typically undergoes crushing and grinding prior to one or more concentration stages in order to produce a saleable product and it is these operations which would benefit from the inclusion of mineral liberation in the Energy Curves.
Although the focus of most mineral liberation measurements on process streams is on the liberation status of the valuable mineral(s), when we look at primary comminution products it is more logical to focus on the gangue liberation. The reason for this is that the primary comminution stages are usually designed as a gangue liberation stage since, depending on the ore head grade, gangue can comprise up to 99% of the feed mass. In effect the objective of primary comminution is to create two types of particles - liberated gangue which can be rejected to final tailing in the initial separation stage (for example rougher/scavenger flotation) and particles which contain the target mineral(s) in a form which can be recovered in the separation step. Note that the particles which contain the target mineral do not need to be liberated, but only need to contain enough target mineral in the particle for it to be recovered. For example, research by CSIRO in the 1980s (Sutherland, 1989) showed that particles needed as little as 10% chalcopyrite on the surface for the particle to be recovered in flotation. These low grade particles are recovered in a rougher/scavenger flotation and then the much smaller tonnage of concentrate containing these particles is submitted to regrinding. The purpose of regrinding is to liberate more gangue from the low grade particles and to generate particles which are of sufficiently high grade to form a concentrate of the required quality. The schematic in Figure 2 shows a simplified view of this process which highlights the strategy of a primary grind size which is just fine enough to liberate gangue and which produces target mineral containing particles that can be recovered.
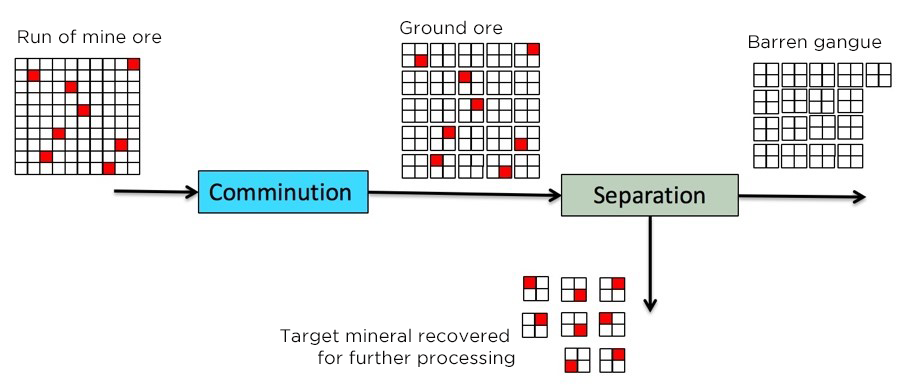
Figure 2– Schematic showing simplified view of typical liberation strategy in primary comminution/separation
The approach taken to incorporate liberation data in the Energy Curves is to consider that the energy in the primary comminution stage is invested to liberate gangue and on that basis to estimate the energy consumed per unit mass of liberated gangue generated in the grinding product. The required mineral liberation data are available as standard outputs from the most common automated mineralogy systems. The size distribution of the grinding product is not explicitly included in the calculation but its effect is implicit in the energy data since a finer grinding product would require more comminution energy. To illustrate the use of this approach the data in Table 1 compares the results of applying the approach to incorporate liberation data in the Energy Curves to data from two base metal operations.
Table 1 – Examples of calculated energy for gangue liberation for two base metal ores
|
|
Base metal ore A |
Base metal ore B |
|
Head grade (% target mineral(s)) |
15 % |
5.5 % |
|
Circuit type |
Ball mill - cyclone |
SABC |
|
P80 of flotation feed |
70 µm |
170 µm |
|
Comminution energy per unit mass liberated gangue (kWh/t Lib gangue) |
70 |
22 |
The finer grind of the flotation feed for Ore A is a result of the finer-grained nature of this ore compared to Ore B and the higher value of the comminution energy per unit mass of liberated gangue reflects this difference in ore characteristics which underpin the process design and operating strategy of these concentrators.
One of the challenges in incorporating liberation data into the energy curves is that while all mineral processing operations measure their throughput and energy consumption, a much smaller number perform regular mineralogical analyses of their flotation feed and products and even fewer publish this information. This makes it difficult to construct an extensive, multi-site energy curve which incorporates liberation in this early stage of development but as more sites contribute their data to the confidential Energy Curves program the coverage of the liberation energy curves will increase to match that of the existing suite of curves.
Alongside information about mineral liberation, it would be useful to see recovery incorporated in the suite of curves. However, metal recovery (and concentrate grade to which it is related) is affected by many factors including the operating parameters of the concentration process which in many cases is flotation. While the flotation feed size and liberation status do have an effect on recovery, the separation processes are strongly controlled by other factors such as ore type, flotation chemistry and operational constraints. As a result it is more challenging to make a consistent link between comminution energy and the recovery of a subsequent flotation stage. The mineralogically limited grade recovery curve obtained from mineralogical analysis is a possible replacement for measured plant recovery data and this potential pathway to include a measure of recovery potential can be investigated in future once a sufficiently large set of the required mineralogical data has been contributed to the Energy Curves database.


